Statistics — Univariate, Bivariate and Multivariate Analysis
In the field of Data Science, there is nothing more important than understanding the data. Understanding the data can save our time and make our model more strong. There are a lots of different tools and techniques which can be used to conduct analysis.
We generally come across Univariate, Bivariate and Multivariate analysis terms while giving interviews or applying stats on our data. For every Data job understanding of these concepts are must.
Univariate analysis are descriptive statistical analysis techniques. Univariate analysis is the simplest form of analyzing data. “Uni” means “one”, so in other words your data has only one variable.
For example, The pie charts involve only one variable. Gender and payment methods are also an example of Univariate analysis. In below mentioned screenshot we can see distribution of Age (Numerical Variable) and Business travel (Categorical variable).


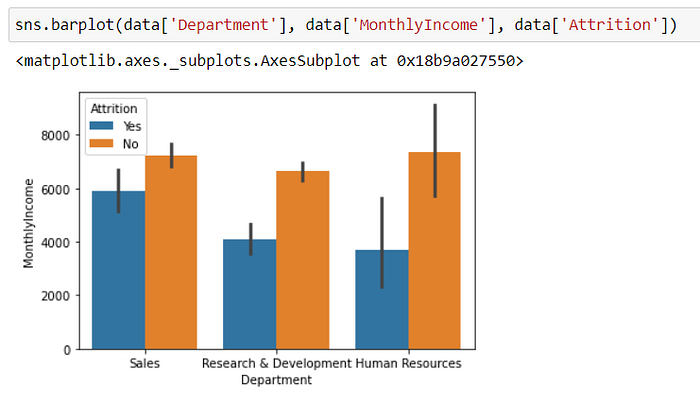
Bivariate analysis attempts to understand the difference between two variables at a time as in a scatterplot. Two variables are analyzed together for any possible relationship.
For example, Applications in Scatterplot, Regression Analysis (age and average height of men and women). In below mentioned screenshot we can see relationship of one categorical variable (Department) and one Numerical/ Continuous variable (Monthly Income). On the second screenshot we can see relationship between two Numerical/ Continuous variables (Age and Monthly Income)


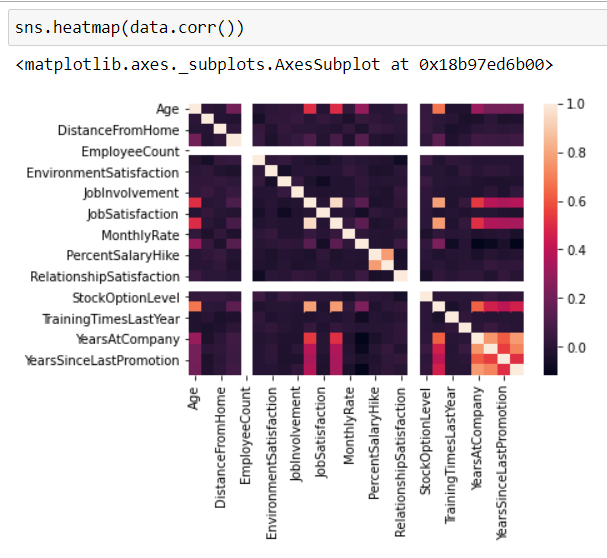
Multivariate analysis deals with the study of more than two variables to understand the effect of variables on the responses. Analysis that deals with more than two variables to understand the differences is multivariate analysis.
For example, Multivariate regression and MANOVA, Principal components analysis and factor analysis and Cluster analysis. In below mentioned screenshot we can see Correlation Heatmap using seaborn library between all numerical variables. On the second screenshot we can see relationship between three variables.
Variable Types
Qualitative or Categorical variables — Defines quality of data. Generally Non numbers (Not all of the time). Variables that have a finite number of categories or distinct groups. We cant perform any math operation on these variables. Examples: Contact number, gender and method of payment etc.
Quantitative or Numerical variables — Defines quantity of data. Variables that consist of numbers. There are two main numerical variables. Math operations are possible. Examples: Ratio, weight, height and temperature etc.
Quantitative is of two types. Discrete and Continuous.
Discrete: — A whole number. Discrete data can only take particular values. e.g., How many cars do you have, no. of students in class. In programming term we can call it an integer.
Continuous : — height, weight etc. In programming term we can call it a float value.
Summary
Univariate analysis looks at one variable, Bivariate analysis looks at two variables and their relationship. Multivariate analysis looks at more than two variables and their relationship.
All methods and techniques which I have mentioned above will be covered in my upcoming articles.